Custom software typically costs $10,000 to $49,999 for a reviewed project on Clutch, while the average across all reviewed projects is $132,480 over about 13 months.
This roundup gathers 49 verified software development cost statistics on market growth, project cost by size, hourly rates by region, cost by phase, hidden and maintenance costs, overruns, and ROI, each linked to its named source.
The headline numbers: the global custom software market is forecast to reach $146.18 billion by 2030 (Grand View Research), and maintenance takes 60 to 80 percent of a system lifetime cost (IEEE). The rest of this page shows the data behind those claims.
If you are new to the topic, start with our guide to what custom software development is before you read the numbers below.
| Section | Standout stat | Source |
|---|---|---|
| Market size and growth | $146.18B market by 2030, growing 22.6% a year | Grand View Research, 2025 |
| Average project cost | $132,480 average; most projects $10,000 to $49,999 | Clutch, 2026 |
| Hourly rates by region | US $50 to $99; Asia senior $31 to $41 | Clutch / Accelerance, 2026 |
| Cost by phase | Backend about 40%; QA 15 to 20% | CodingCrafts, 2026 |
| Hidden and maintenance costs | Maintenance 60 to 80% of lifetime cost | IEEE |
| Overruns and failure | Large IT projects 45% over budget | McKinsey / Oxford, 2012 |
| ROI and build vs buy | 90.6% of firms use AI to cut costs | GoodFirms, 2026 |
Custom Software Market Size and Growth
Custom software is a large and fast-growing market. Demand is driven by automation, cloud migration, and AI features becoming standard in business software.
A market heading for $146 billion
- $146.18 billion by 2030. Grand View Research estimates the global custom software development market will reach USD 146.18 billion by 2030. Source: Grand View Research, 2025
- 22.6% annual growth. The same Grand View Research report puts the market CAGR at 22.6% from 2025 to 2030. Source: Grand View Research, 2025
- Enterprise software holds over 60%. The enterprise software type segment accounted for the largest revenue share of the market, over 60.0% in 2024. Source: Grand View Research, 2025
- Cloud holds 57%. By deployment mode, the cloud segment accounted for the largest market share, 57.0% in 2024. Source: Grand View Research, 2025
The US market and global software spending
- US market: $9.08 billion to $29.67 billion. Grand View Research valued the US custom software development market at USD 9.08 billion in 2023 and forecasts USD 29.67 billion by 2030, a CAGR of 18.5%. Source: Grand View Research, US report
- Software spending hit $1.24 trillion in 2025. Gartner forecast worldwide software spending of $1.24 trillion in 2025, up 14.0% on 2024, with overall IT spending at $5.74 trillion. Source: Gartner, October 2024, via TeamDynamix
Growth this fast means more vendors and more price spread. The ranges in the next section are wide because the market covers everything from a small internal tool to an enterprise platform.
Average Project Cost by Size
There is no single price for custom software. The honest answer is a range tied to size, and the two best public references are Clutch and GoodFirms.
What Clutch verified reviews show
- $132,480 average project. Clutch, which collects prices from verified client reviews, reports an average software development project cost of about $132,480. Source: Clutch, 2026, via Blur Studio
- Most projects cost $10,000 to $49,999. The most common cost band on Clutch is $10,000 to $49,999, so the average is pulled up by a few very large projects. Source: Clutch, 2026, via Blur Studio
- About 13 months. The average reviewed project on Clutch takes about 13 months to complete. Source: Clutch, 2026, via TechLand Engineering
What GoodFirms 2026 survey of 100 plus firms shows
- Medium projects: $30,000 to $100,000. In the GoodFirms 2026 survey of more than 100 software development firms, 65.7% named $30,000 to $100,000 as the typical cost of a medium project. Source: GoodFirms, 2026, via Code and Core
- Large projects: $100,000 to $200,000. In the same survey, 14.1% of firms named $100,000 to $200,000 as the typical cost of a large project. Source: GoodFirms, 2026, via Code and Core
- AI builds: $50,000 to $125,000. In the GoodFirms survey, 71.9% of AI companies charge between $50,000 and $125,000 for small to mid-scale AI builds. Source: GoodFirms, 2026
- Mobile apps: up to $50,000 for an MVP. In the GoodFirms survey, 78.2% of mobile app companies charge up to $50,000 for MVP to simple apps, and 56.3% of app costs sit in the $5,000 to $50,000 range. Source: GoodFirms, 2026
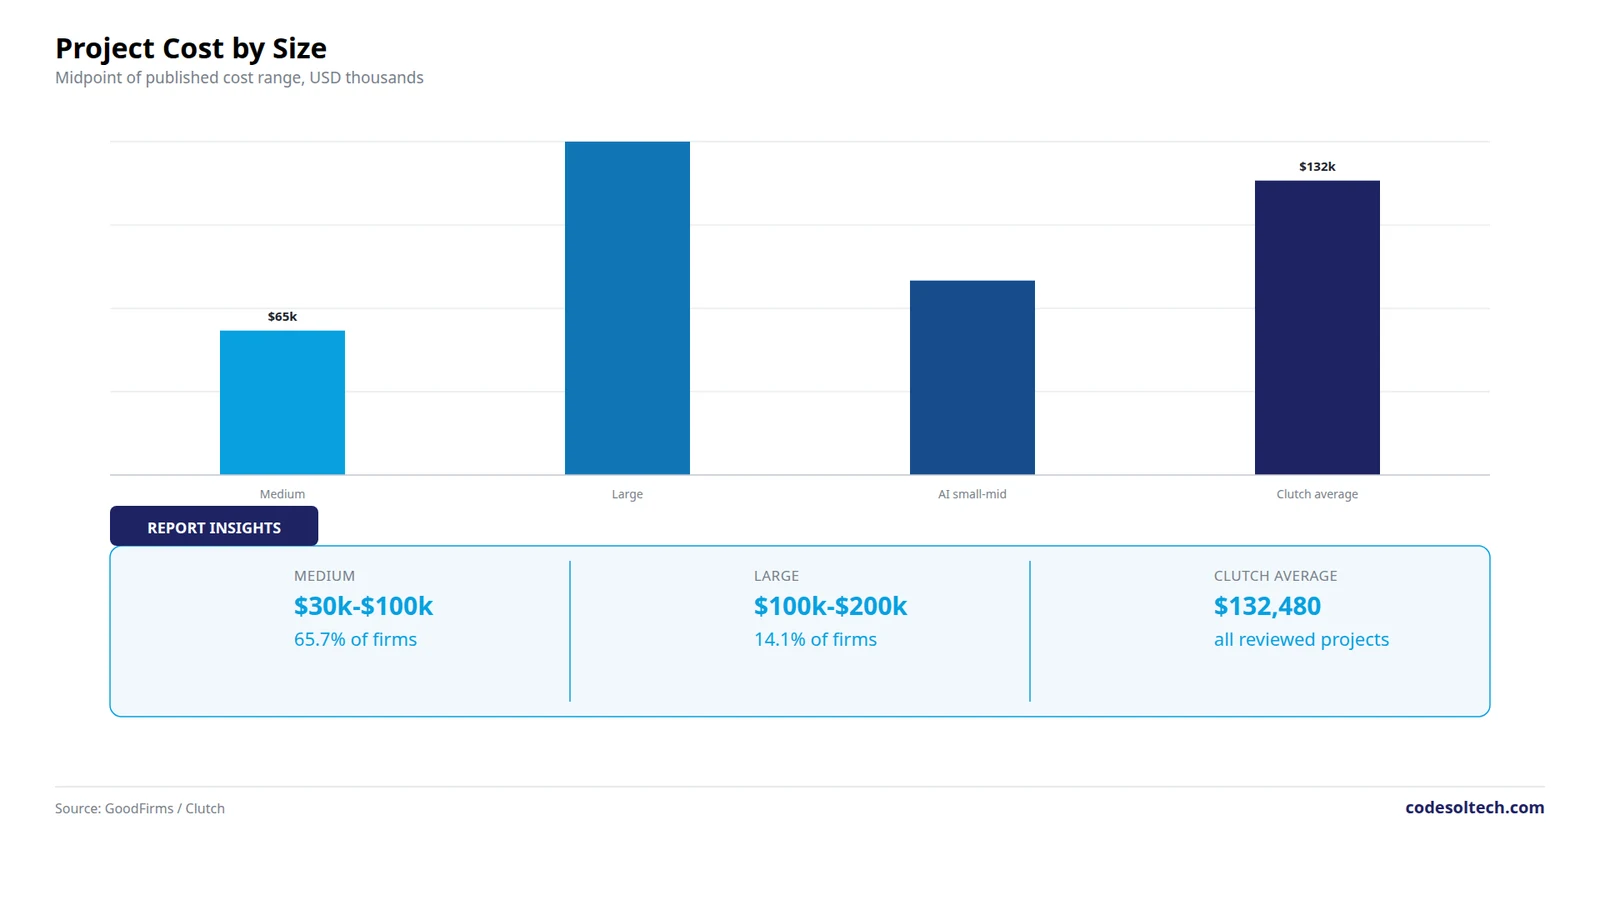
Read the average and the typical project as two different numbers. A small internal tool is nowhere near the $132,480 average, because that average includes large enterprise builds. See our custom CRM development cost guide for a worked example in one category.
Hourly Rates by Region
Location moves the hourly rate more than almost anything else. The same senior developer can cost three to four times as much in North America as in Asia.

Clutch average rates by location
- United States: $50 to $99 an hour. Clutch lists $50 to $99 per hour as the average band for US software development companies. Source: Clutch, 2026, via TechLand Engineering
- Canada and Australia: $100 to $149 an hour. Clutch lists $100 to $149 per hour for software development companies in Canada and Australia. Source: Clutch, 2026, via TechLand Engineering
- India, Philippines, Ukraine, Mexico: $25 to $49 an hour. Clutch lists $25 to $49 per hour for software development companies in India, the Philippines, Ukraine, and Mexico. Source: Clutch, 2026, via Blur Studio
Accelerance 2026 senior rates
- Asia senior: $31 to $41 an hour. Accelerance, which surveyed more than 60 software development partners for its 2026 rates guide, puts senior developer rates in Asia at $31 to $41 an hour. Source: Accelerance, 2026, via ReliaBuilds
- Europe senior: $64 to $76 an hour. The same Accelerance guide puts senior developer rates in Europe at $64 to $76 an hour. Source: Accelerance, 2026, via ReliaBuilds
- Latin America senior: $60 to $75 an hour. The same Accelerance guide puts senior developer rates in Latin America at $60 to $75 an hour. Source: Accelerance, 2026, via ReliaBuilds
- Rates fell in every region in 2025. Accelerance reports average rates dipped by nearly 8% in Asia, 7.1% in Latin America, and 4.4% in Europe over the past year. Source: Accelerance, 2026, via ReliaBuilds
What a US developer earns
- $135,980 median annual wage. The US Bureau of Labor Statistics reports a median annual wage of $135,980 for software developers in May 2025, before benefits, overhead, or a firm margin. Source: US Bureau of Labor Statistics, May 2025, via TechLand Engineering
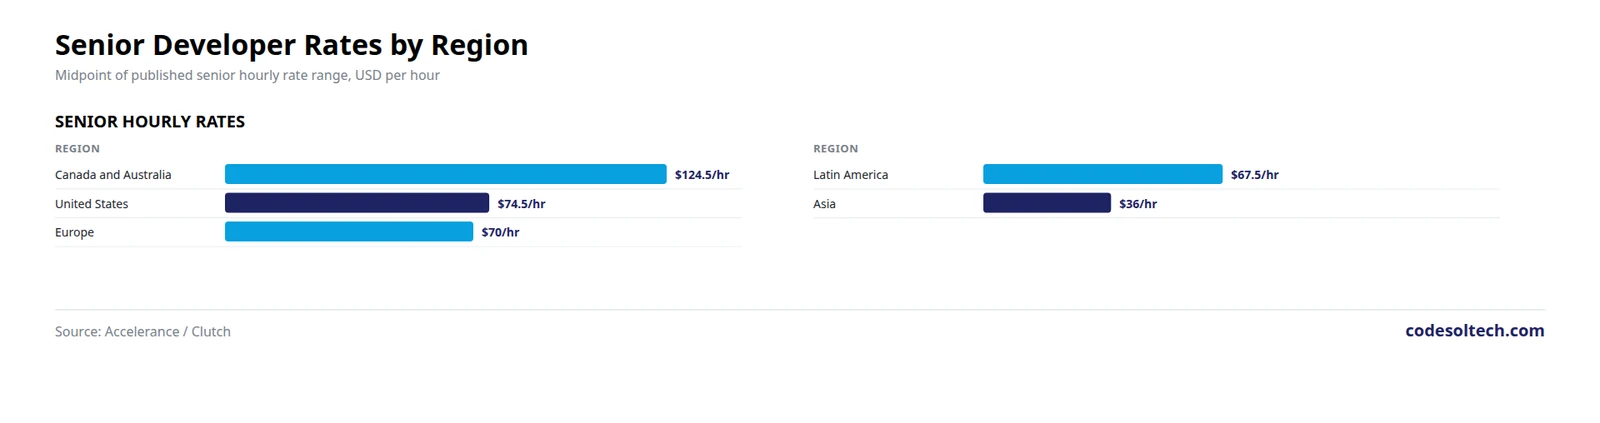
A low hourly rate is not a low project cost. Accelerance itself warns that bargain rates often bring scope creep, rework, and delays that cancel the saving. Compare website development costs in Austin to see how US secondary hubs price against the top tier.
Cost by Development Phase
A software budget is not one number. It is several numbers: planning, design, development, testing, deployment, and the people who do the work.
Where the build budget goes
- Planning: about 10%. In the CodingCrafts 2026 cost breakdown, planning and requirements take about 10% of project cost. This is a planning range, not a measured survey average. Source: CodingCrafts, 2026
- Backend: about 40%. In the same breakdown, backend development takes about 40% of project cost, the largest single share. Source: CodingCrafts, 2026
- Testing and QA: 15 to 20%. In the same breakdown, testing and QA take 15 to 20% of project cost. Source: CodingCrafts, 2026
- Development: 40 to 60%. LimeUp puts core development at 40 to 60% of the total budget in its 2026 UK cost breakdown. Source: LimeUp, 2026
- Deployment: 5 to 10%. LimeUp puts deployment, including CI/CD, server setup, and the production release, at 5 to 10% of the total budget. Source: LimeUp, 2026
People are the biggest line item
- People cost 50 to 70% of the total. In the GoodFirms 2026 survey, respondents said nearly 50 to 70% of total software development cost can be tied to developers, UX/UI designers, QA, and project managers. Source: GoodFirms, 2026
The phase split explains why cutting design or testing rarely saves money. Those phases are small shares of the budget, and skipping them moves cost into rework later.
Hidden and Maintenance Costs
The build quote is only the first invoice. Maintenance, technical debt, integrations, and unused licences keep charging long after launch.

Maintenance is the larger half of the bill
- 10 to 20% of build cost every year. In the GoodFirms 2026 survey, companies spend an average of 10 to 20% of the build cost annually on post-launch maintenance, bug fixes, and updates. Source: GoodFirms, 2026
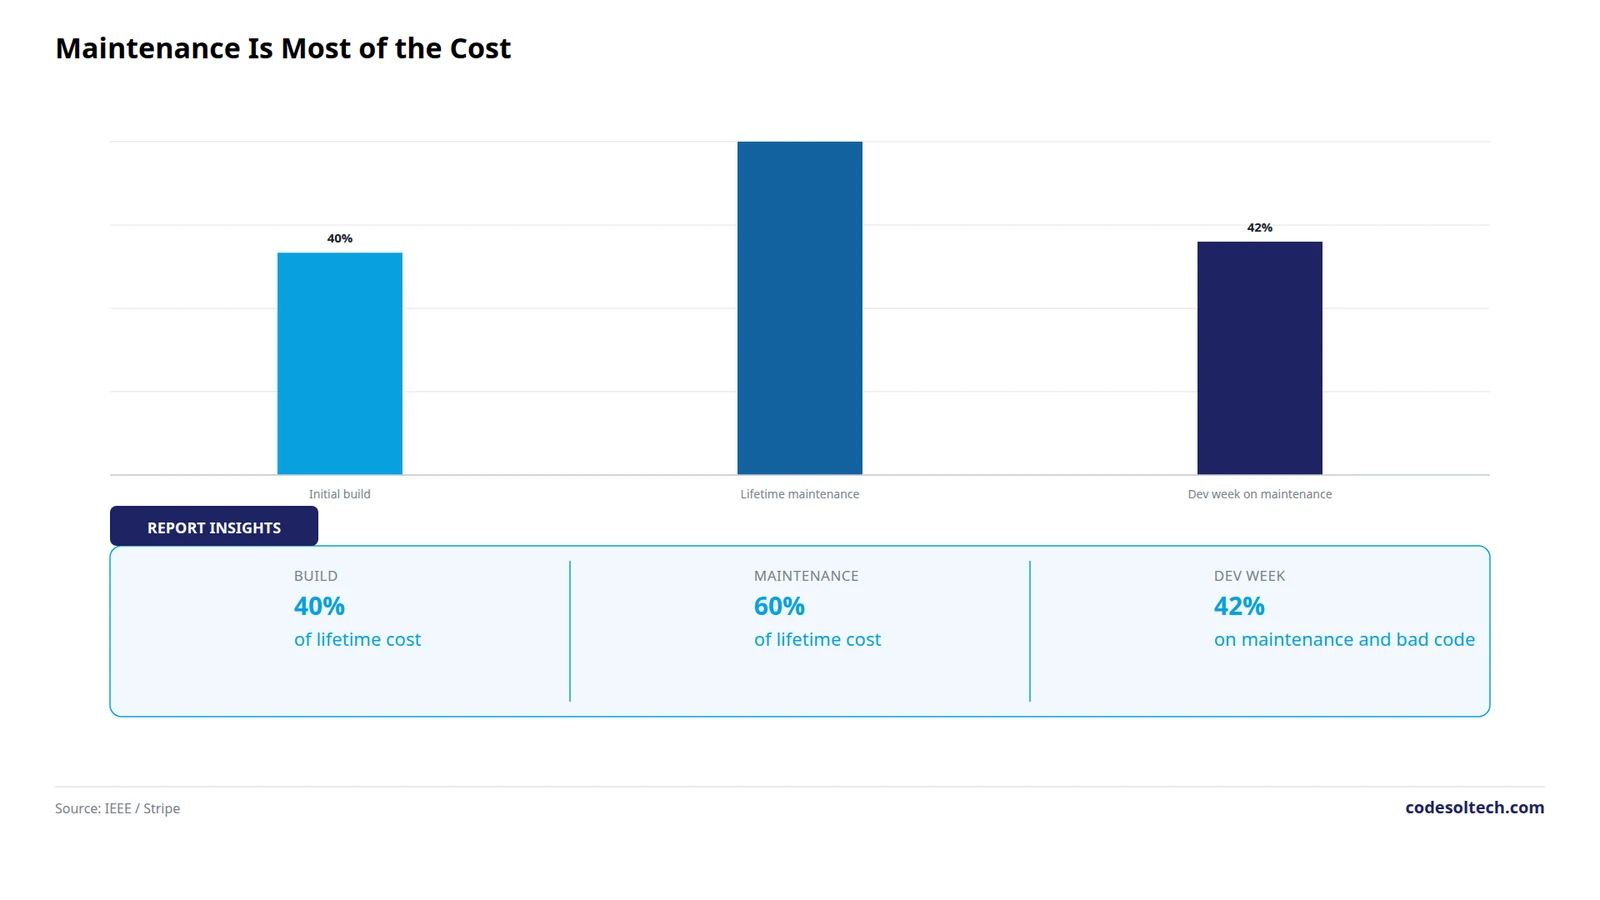
- Maintenance is 60 to 80% of lifetime cost. The IEEE Computer Society puts maintenance at 60 to 80% of the total lifecycle cost of a software system. Source: IEEE, via Pegotec
- 55 to 80% of IT budgets go to maintenance. Gartner research puts the share of enterprise IT budgets spent maintaining existing systems at 55 to 80%. Source: Gartner, via Pegotec
Technical debt and integration waste
- 17.3 hours a week on maintenance. In Stripe Developer Coefficient survey (2018, 1,000 plus developers and 1,000 plus executives), engineers spend an average of 17.3 hours of a 41.1-hour week, about 42%, on maintenance and bad code. Source: Stripe, 2018
- Bad code costs about $85 billion a year. The same Stripe study puts the global opportunity cost of bad code at nearly $85 billion annually. Source: Stripe, 2018
- 897 apps, only 29% integrated. In the MuleSoft 2025 Connectivity Benchmark Report (1,050 IT leaders), the average enterprise runs 897 applications, yet only 29% of them are integrated. Source: MuleSoft, 2025
- 32% of SaaS spend wasted. Flexera 2023 State of IT Asset Management Report found an estimated 32% of SaaS spend is wasted or underused. Source: Flexera, 2023, via ClauseAudit
Budget the second year before you sign the first. A $100,000 build at 10 to 20% a year costs $10,000 to $20,000 a year to keep healthy, before any new features.
Cost Overruns and Project Failure
Software projects overrun so often that the overrun is the normal outcome, not the exception. The research behind this is unusually strong, and it is also old, so each stat below carries its year.
McKinsey and Oxford: large IT projects
- 45% over budget, 7% over time, 56% less value. McKinsey and the University of Oxford analysed more than 5,400 IT projects and found large ones ran on average 45% over budget and 7% over time, while delivering 56% less value than predicted. Source: McKinsey / Oxford, 2012, via Softonoma
- $66 billion in total overruns. Across the 5,400 projects in the McKinsey and Oxford study, total cost overruns came to $66 billion. Source: McKinsey / Oxford, 2012, via Softonoma
- 17% become black swans. The same study found around 17% of large IT projects overrun by more than 200%, enough to threaten the company running them. Source: McKinsey / Oxford, 2012, via Softonoma
Standish CHAOS: three decades of outcomes
- 31% succeed, 50% challenged, 19% failed. The Standish Group final CHAOS edition (2020) reports 31% of projects succeeding on time, on budget, and on scope, 50% challenged, and 19% cancelled. Source: Standish Group, CHAOS 2020, via Softonoma
- 1994: 16.2% succeeded, 31.1% cancelled. In the original 1994 CHAOS survey, only 16.2% of projects succeeded and 31.1% were cancelled, and challenged projects averaged 189% of their original cost estimate. Source: Standish Group, CHAOS 1994, via Softonoma
- Small projects succeed about 90% of the time. Standish data puts small-project success near 90%, against under 10% for the largest projects. Source: Standish Group, via Softonoma
Scope creep is the usual suspect
- 52% of projects experience scope creep. PMI Pulse of the Profession 2018 found 52% of projects completed in the prior 12 months had scope creep, causing an average budget overrun of 27%. Source: PMI, 2018, via PM Study Circle
- 9.9% of every dollar wasted. PMI 2018 report found 9.9% of every dollar was wasted due to poor project performance. Source: PMI, 2018, via UseTandem
- 65.6% of firms see scope creep add 10 to 25%. In the GoodFirms 2026 survey, 65.6% of respondents said scope creep typically increased project cost by 10 to 25%, and 86% said changing client needs was a recurring issue. Source: GoodFirms, 2026
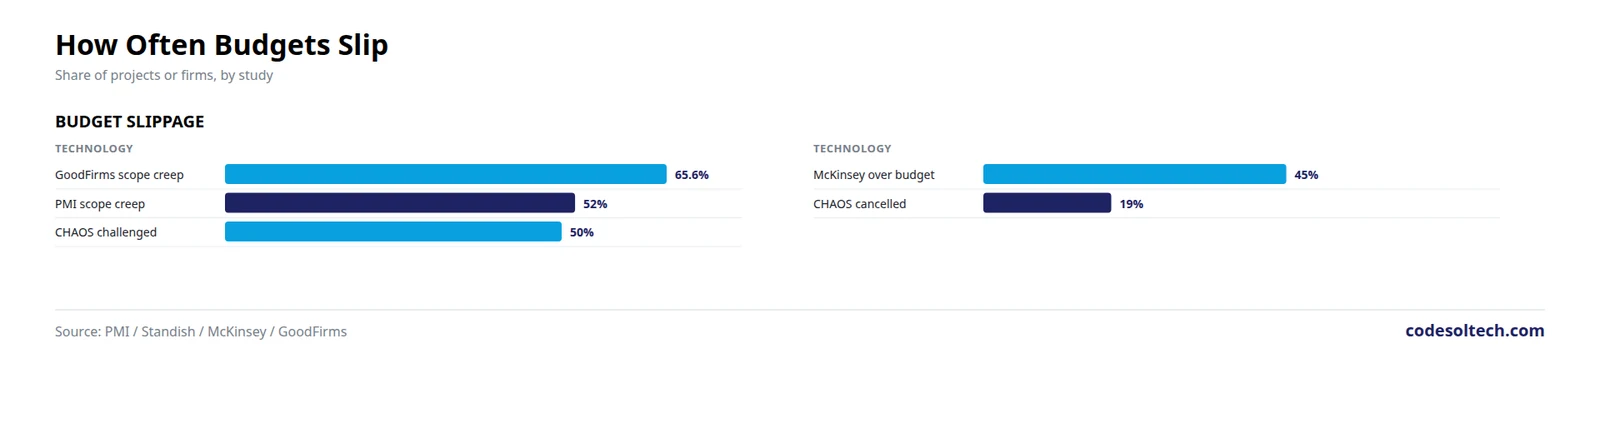
Size is the strongest predictor in the data. One large build at under 10% odds is far riskier than the same scope delivered as a sequence of small builds at about 90% each.
ROI, Pricing Models, and Build vs Buy
The build vs buy decision is a five-year cost decision, not a first-invoice decision. Licences look cheap until integration, waste, and growth are counted.
AI is cutting build cost
- 90.6% of firms use AI to cut costs. In the GoodFirms 2026 survey, 90.6% of participants said they have adopted AI tools to reduce software development costs. Source: GoodFirms, 2026
- 61% expect AI to trim costs 10 to 25%. In the same survey, nearly 61% of firms believe AI will trim costs by 10 to 25%. Source: GoodFirms, 2026
How firms price the work
- Time and Material: 81.3%. In the GoodFirms 2026 survey, 81.3% of software companies prefer Time and Material pricing, and 65.6% offer fixed-price project pricing. Source: GoodFirms, 2026
- Agile: 84.4%. In the same survey, 84.4% of participant companies rely on Agile for software development. Source: GoodFirms, 2026
- Cross-platform saves 20 to 40%. In the GoodFirms 2026 app cost survey, cross-platform development can reduce initial costs by 20 to 40% compared with building two native apps. Source: GoodFirms, 2026, via Code and Core
The buy side has waste too
- 36% of SaaS licences go unused. The Zylo SaaS Management Index 2026 found 36% of SaaS licences unused against recommended use levels, measured from customer usage data. Source: Zylo, 2026, via DigitalTreed
Compare five-year totals, not first-year prices. A custom build costs more up front and nothing per seat, while a subscription charges per user forever and still needs integration work.
See our custom vs off-the-shelf software guide and our custom CRM vs HubSpot vs Salesforce comparison for the same math in one category.
Methodology: How These Stats Were Verified
The canonical overrun studies are old, and the page says so. Standish CHAOS dates to 1994 and 2020, McKinsey and Oxford to 2012, and Stripe to 2018. Each stat carries its study year in the text, so a 2012 finding is never presented as a 2026 measurement.
Where the original report is paywalled, offline, or blocks automated checks, the figure is attributed to the original researcher and the working source is named.
Examples: Clutch figures via Blur Studio and TechLand Engineering, Accelerance figures via ReliaBuilds, and McKinsey, Standish, and PMI figures via Softonoma, PM Study Circle, and UseTandem.
Gartner press release blocks automated checks with a 403 response, so its software spending figures are cited through the TeamDynamix summary of the same October 2024 release, which returned HTTP 200. The release itself was also read in full in a browser on 16 November 2026.
Chart values that are midpoints of published ranges are labelled as midpoints in the chart subtitle and caption. Phase split percentages from CodingCrafts and LimeUp are agency planning ranges, not survey measurements, and the page labels them as such.
Several famous claims were left out because no primary source could be traced: a McKinsey 162% ROI figure for custom software, a Deloitte 41% cost reduction figure, an IBM 73% unused features figure, and a Gartner 87% budget overrun figure for off-the-shelf customisation.
Frequently Asked Questions
How much does custom software development cost?
Most reviewed projects cost $10,000 to $49,999, and the average across all reviewed projects is $132,480 over about 13 months (Clutch, 2026).
In the GoodFirms 2026 survey of more than 100 firms, 65.7% named $30,000 to $100,000 as the typical cost of a medium project, and 14.1% named $100,000 to $200,000 for a large project. Your price depends on scope, team location, and integrations, so treat these as ranges, not quotes.
How much does it cost per hour to hire a software developer?
Clutch 2026 lists $50 to $99 an hour for US software development companies, $100 to $149 in Canada and Australia, and $25 to $49 in India, the Philippines, Ukraine, and Mexico.
For senior developers, Accelerance 2026 puts rates at $31 to $41 an hour in Asia, $64 to $76 in Europe, and $60 to $75 in Latin America. The US Bureau of Labor Statistics reports a median annual wage of $135,980 for US software developers (May 2025).
How much should I budget for software maintenance?
Plan 10 to 20% of the build cost every year, per the GoodFirms 2026 survey. On a $100,000 build, that is $10,000 to $20,000 a year.
Over a system lifetime, the IEEE Computer Society puts maintenance at 60 to 80% of total lifecycle cost, so the build quote is the smaller half of what the software will cost you.
Why do software projects go over budget?
Scope creep is the most common cause. PMI 2018 found 52% of projects experience scope creep, with an average budget overrun of 27%, and GoodFirms 2026 found 65.6% of firms see scope creep add 10 to 25% to cost.
Size matters most: McKinsey and Oxford (2012) found large IT projects run 45% over budget on average, and Standish data puts small-project success near 90% against under 10% for the largest projects.
Is custom software cheaper than buying off the shelf?
It depends on the time horizon. Custom software costs more up front and nothing per seat, while subscriptions charge per user forever and still need integration work.
On the buy side, Flexera 2023 found an estimated 32% of SaaS spend wasted or underused, and Zylo 2026 measured 36% of SaaS licences unused. Compare five-year totals, including maintenance, integration, and licences, before you decide.
Want a website that turns visitors into customers?